







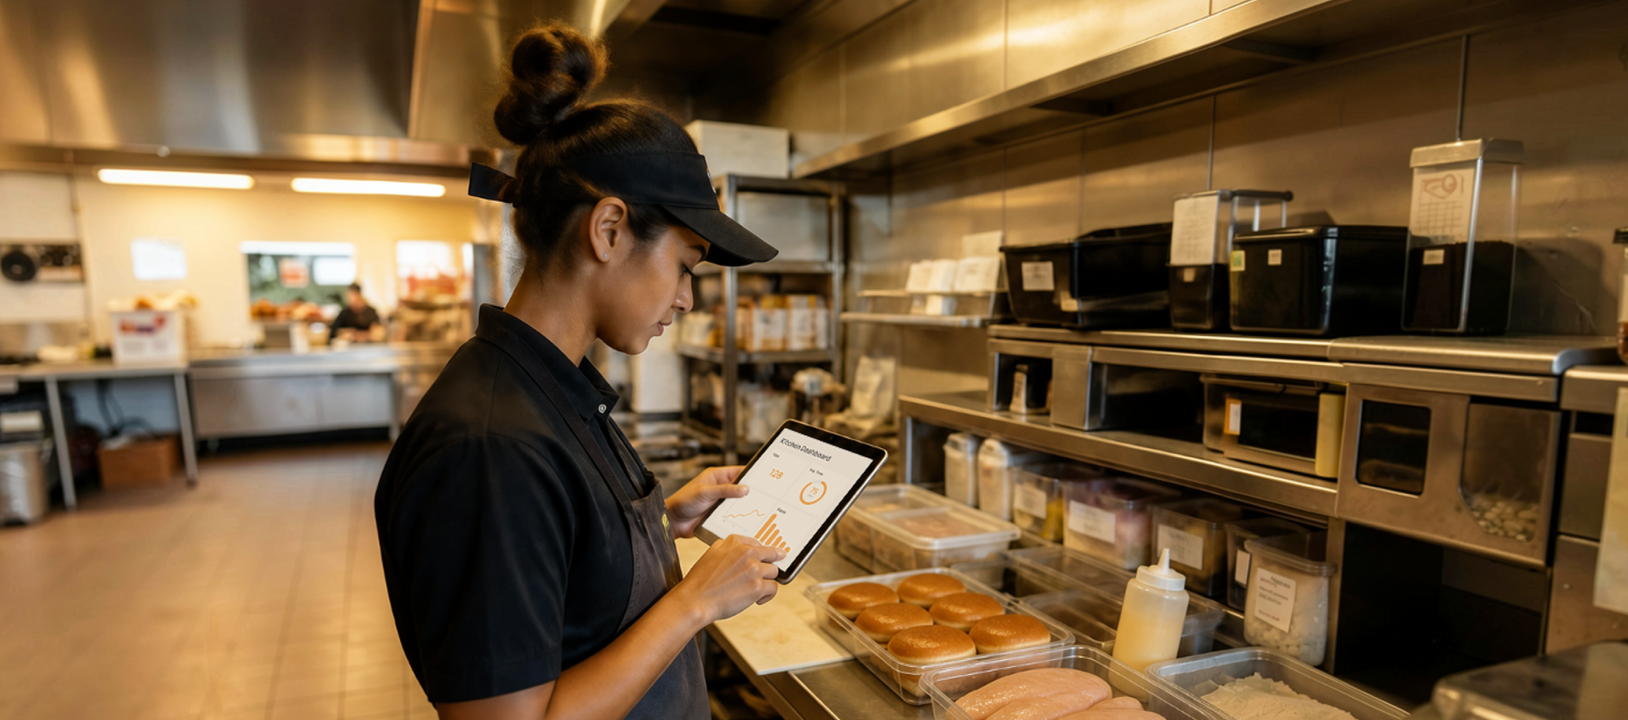


Restaurant demand forecasting fails when the output stops at a chart. A shift lead opening the kitchen at 6 a.m. needs quantities and timing: how many chicken portions to thaw, how many buns to stage, what each station should prepare before lunch, and when the next batch should start. If the system cannot answer those questions, a lower forecast error does not help the crew.
The useful product is not the prediction alone. It is the operating loop between sales data, item-level forecasts, recipe rules, prep instructions, manager judgment, and actual waste or stockout results.
Start with the prep decision, not the model
Many teams begin by debating algorithms. Start one step later instead: define the decision that someone in the restaurant must make.
A chain-level weekly sales forecast helps finance. It does little for the grill station. Kitchen guidance needs a finer grain:
- location and sales channel;
- daypart or shorter time bucket;
- menu item and ingredient requirements;
- station capacity, batch size, cook time, and hold window;
- inventory on hand and product already in prep.
Suppose the model expects 140 chicken sandwiches during lunch. That number still has to pass through recipe and yield data, current inventory, thaw time, holding rules, and station capacity. The result might be a morning thaw task, an opening par, and smaller timed batches during the rush. Those are different outputs for different roles, all derived from the same prediction.
This translation layer deserves the same attention as the forecasting model. It contains the menu mappings, yield assumptions, operational limits, and timing rules that make the number usable. It is also where hidden data problems surface. A POS may record a combo as one item while inventory treats the bun, protein, sauce, and packaging separately. Until that mapping is accurate, ingredient-level guidance is fiction.
Build the data layer around actual restaurant behavior
POS history is the base signal, but raw transactions are not ready for training. Timestamps need a consistent time zone. Refunds, voids, substitutions, channel duplicates, stockouts, and store closures need explicit treatment. Menu identifiers must remain traceable through renames and limited-time offers.
Then add context that can explain departures from the normal pattern:
- promotions, price changes, and coupons;
- holidays, school calendars, sports, and nearby events;
- weather and severe-weather alerts;
- catering orders and planned group traffic;
- delivery marketplace availability;
- known equipment or supply constraints.
Do not add every possible feed on day one. Test whether each signal improves the forecast for a useful horizon. Weather may matter for tomorrow’s staffing and channel mix but add little to a four-week ingredient plan. A concert near one location may matter more than a national holiday flag. Signal value is local.
AWS publishes a restaurant demand forecasting reference architecture that separates ingestion, model training, scheduled predictions, and business-facing consumption. The pattern matters more than the named services: keep source data, forecasts, accuracy measures, and user edits traceable so operators can inspect what changed and why.[1]
New stores and new menu items create a cold-start problem. A practical first version can borrow patterns from stores with similar hours, format, market, and product mix. Managers should have wider override authority while local history accumulates. Test several baseline models, use scenario ranges, and mark anomalous periods rather than waiting for a perfect dataset that may never arrive.
Convert the forecast into station-level guidance
The forecast service should produce a probability range, not a single number presented as certainty. The prep service then applies kitchen constraints and chooses a working quantity.
For each item and time bucket, it needs to account for:
- expected demand and uncertainty;
- product already on hand or in process;
- recipe yield and ingredient availability;
- minimum batch, cook time, and station capacity;
- hold time and the cost of over-prep versus a stockout.
That last tradeoff is item-specific. A cheap item with a short cook time can carry a small buffer. An expensive protein with a long thaw time needs earlier commitment, but over-prepping is costly. One service-level target for the entire menu will produce bad instructions.
The crew should receive tasks, not model vocabulary. “Prepare 18 portions by 10:45” is useful. “P80 forecast increased by 12 percent” belongs in an analyst view. Managers may need the reason behind a change, such as a promotion, event, or recent sales pattern, but the explanation has to remain short enough to use during service.
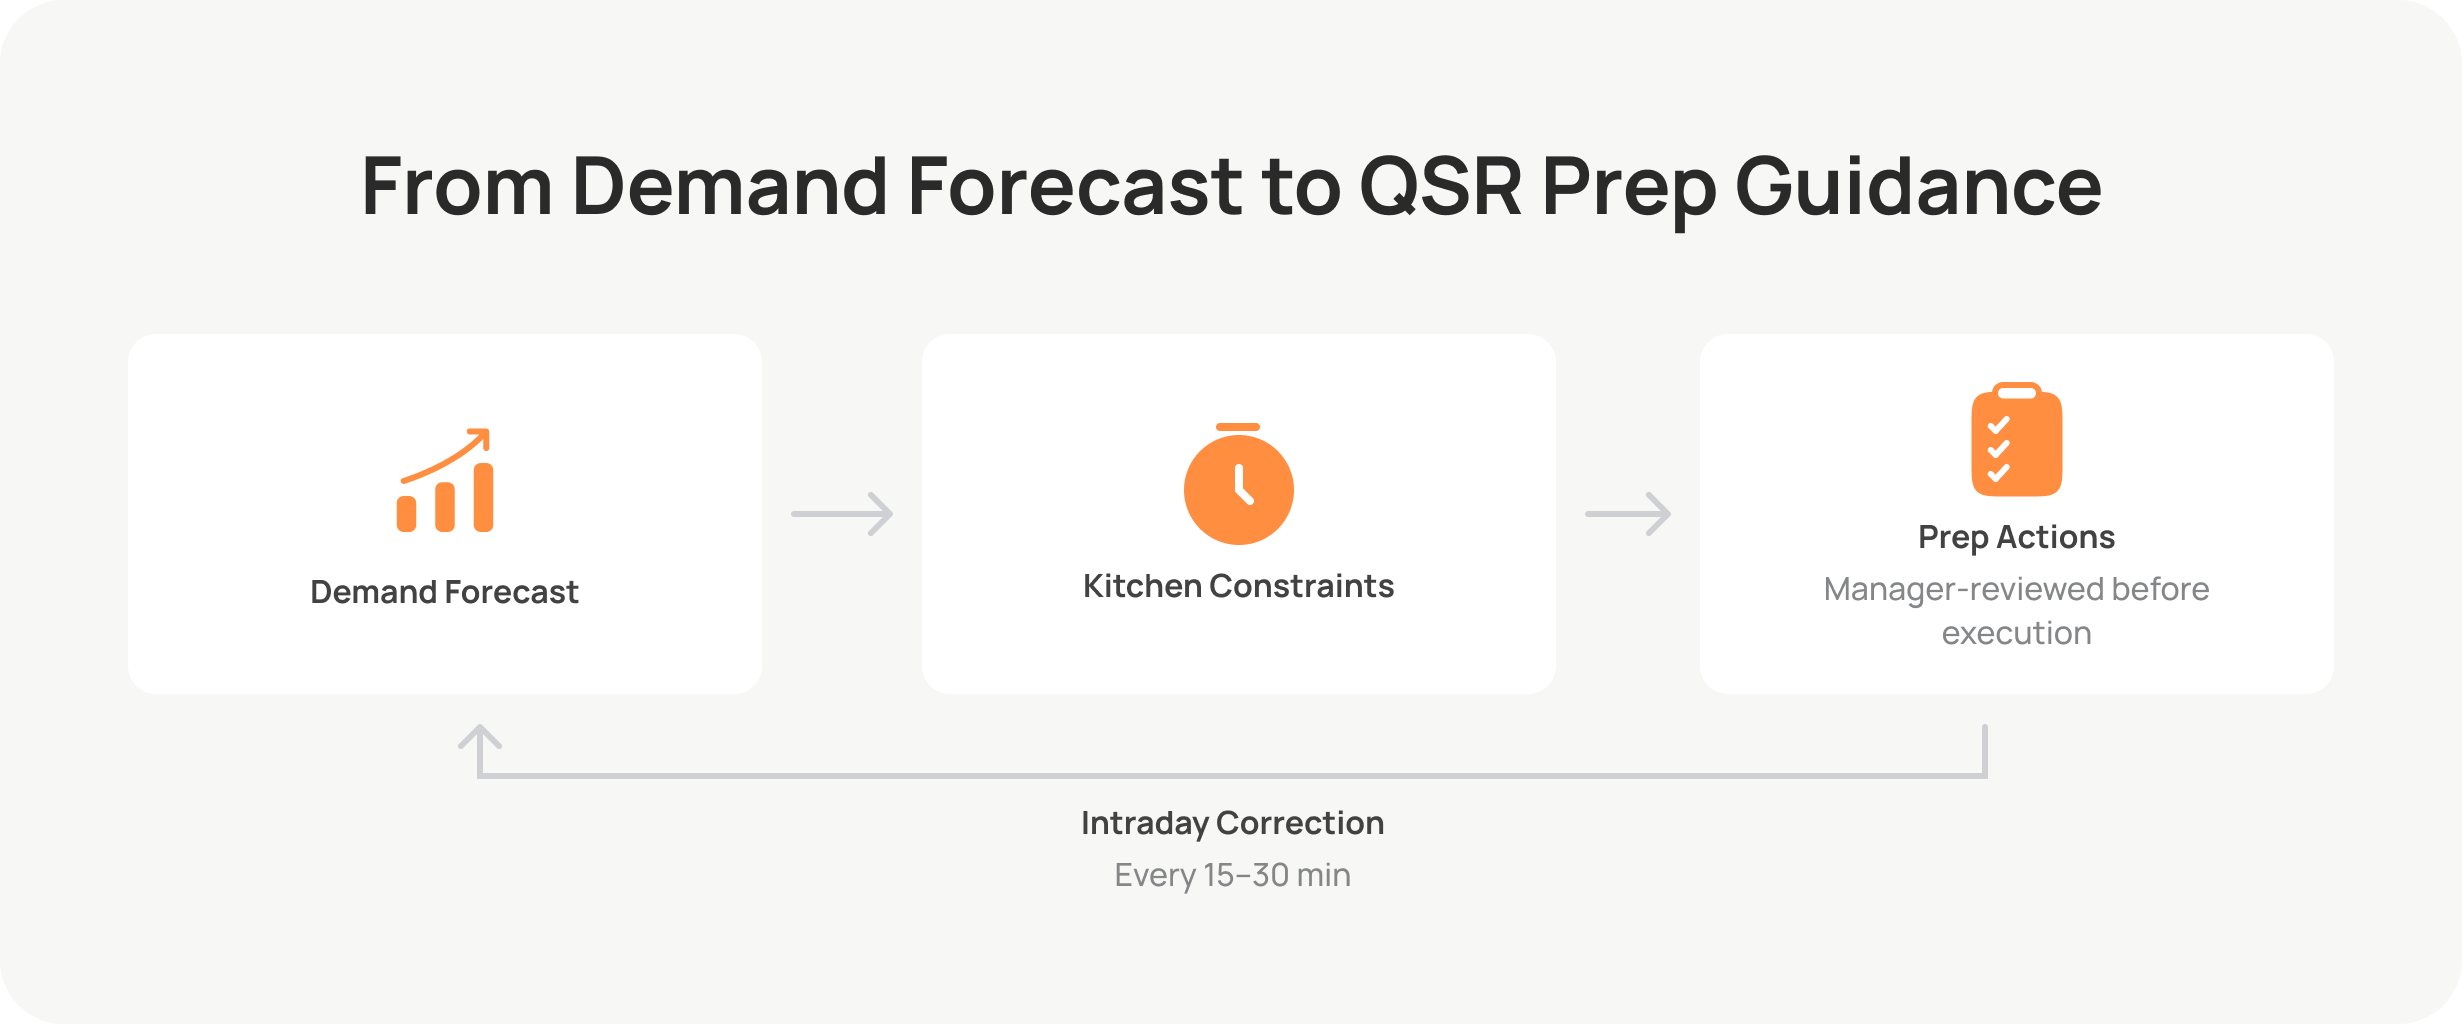
Intraday correction is where static prep sheets become a working system. Actual orders can be compared with the expected curve every 15 or 30 minutes. When the deviation is large enough to matter, the system updates later batches instead of rewriting every task after each ticket. Alert thresholds and quiet periods prevent the KDS from turning into a slot machine.
Keep managers in control and learn from overrides
A manager override is not a failure. It may contain information the model cannot see: a broken fryer, a late delivery, a school bus in the parking lot, or a local promotion entered incorrectly.
Give managers three things:
- a fast way to change or reject a recommendation;
- a short list of reason codes plus an optional note;
- a visible record of what the system recommended and what the manager chose.
Capture the outcome too. If the override prevented a stockout, that is useful evidence. If it causes over-prep, the team can review the decision without blaming the person who made it under pressure.
The dangerous design is silent automation. A bad recommendation can travel from the model to every store before anyone notices. Use limits for unusually large changes, require approval for high-cost items, and keep a fallback prep method when the forecast service or network is unavailable. Production software needs boring failure behavior. Kitchens have enough excitement already.
Close the loop with sales, waste, and holding data
Forecast accuracy is necessary, but it is not the business result. Track the full chain:
- forecast error by store, item, daypart, and horizon;
- over-prep and discarded product;
- stockouts, emergency batches, and unavailable menu items;
- hold-time violations;
- manager override rate and reasons;
- task completion and service-level results.
Manual waste logs can help, but they are often incomplete during a rush. Sensors or computer vision can add a second measurement layer by detecting holding-bin state, product movement, or waste events. This is not a reason to install cameras everywhere. Use hardware where the value of better ground truth exceeds installation, support, privacy, and maintenance costs.
Softarex’s restaurant work follows this combined pattern: POS and promotion data feed item and daypart forecasts; kitchen instructions reach the KDS; sensor or vision events can report what was held, used, or discarded. At measured locations, the deployed system reduced stockout time by 50 to 70 percent, from 350-540 minutes per day to 100-250 minutes.[2] The important design choice is the closed loop. A model trained only on sales cannot distinguish weak demand from a stockout that suppressed sales.
Roll out by operational similarity, not org chart
Do not choose a pilot cohort just because its stores share a region, franchise group, or reporting line. Group locations by menu, service pattern, technology stack, and data quality so the test answers an operational question rather than mirroring the org chart.
A pilot should include enough variation to expose failure modes, but not so much that every store becomes a separate research project. Choose a small group with reliable POS data, engaged managers, and representative menu complexity. Establish a baseline before recommendations reach the kitchen.
Run early forecasts in shadow mode. Compare the suggested prep plan with the manager’s plan and actual results. Then introduce recommendations for a narrow menu group or daypart. Expand only after the data mappings, task flow, and override process work under real service pressure.
Define the scorecard before the pilot starts. Compare each test store with its own recent baseline and, where possible, with similar stores that still use the existing prep process. Review results by item and daypart, not just as a chain average. A lunch improvement can hide worse breakfast waste. Track forecast availability and task delivery as well; a model cannot affect operations if its recommendations arrive after prep has started. Set a fixed review date and a clear decision: expand, revise, or stop.
For build versus buy, use a blunt test. A packaged product is sensible when the menu, POS, and operating process fit its assumptions. A custom layer earns its cost when the chain has unusual prep logic, several legacy systems, strict data placement rules, or wants to combine forecasting with KDS, sensor, and vision data. Building the model is rarely the largest job. Maintaining connectors, menu mappings, monitoring, and store-specific configuration is where the work accumulates.
The test is concrete: the 6 a.m. shift lead gets a better prep sheet, waste and stockouts move in the right direction, and managers retain control.