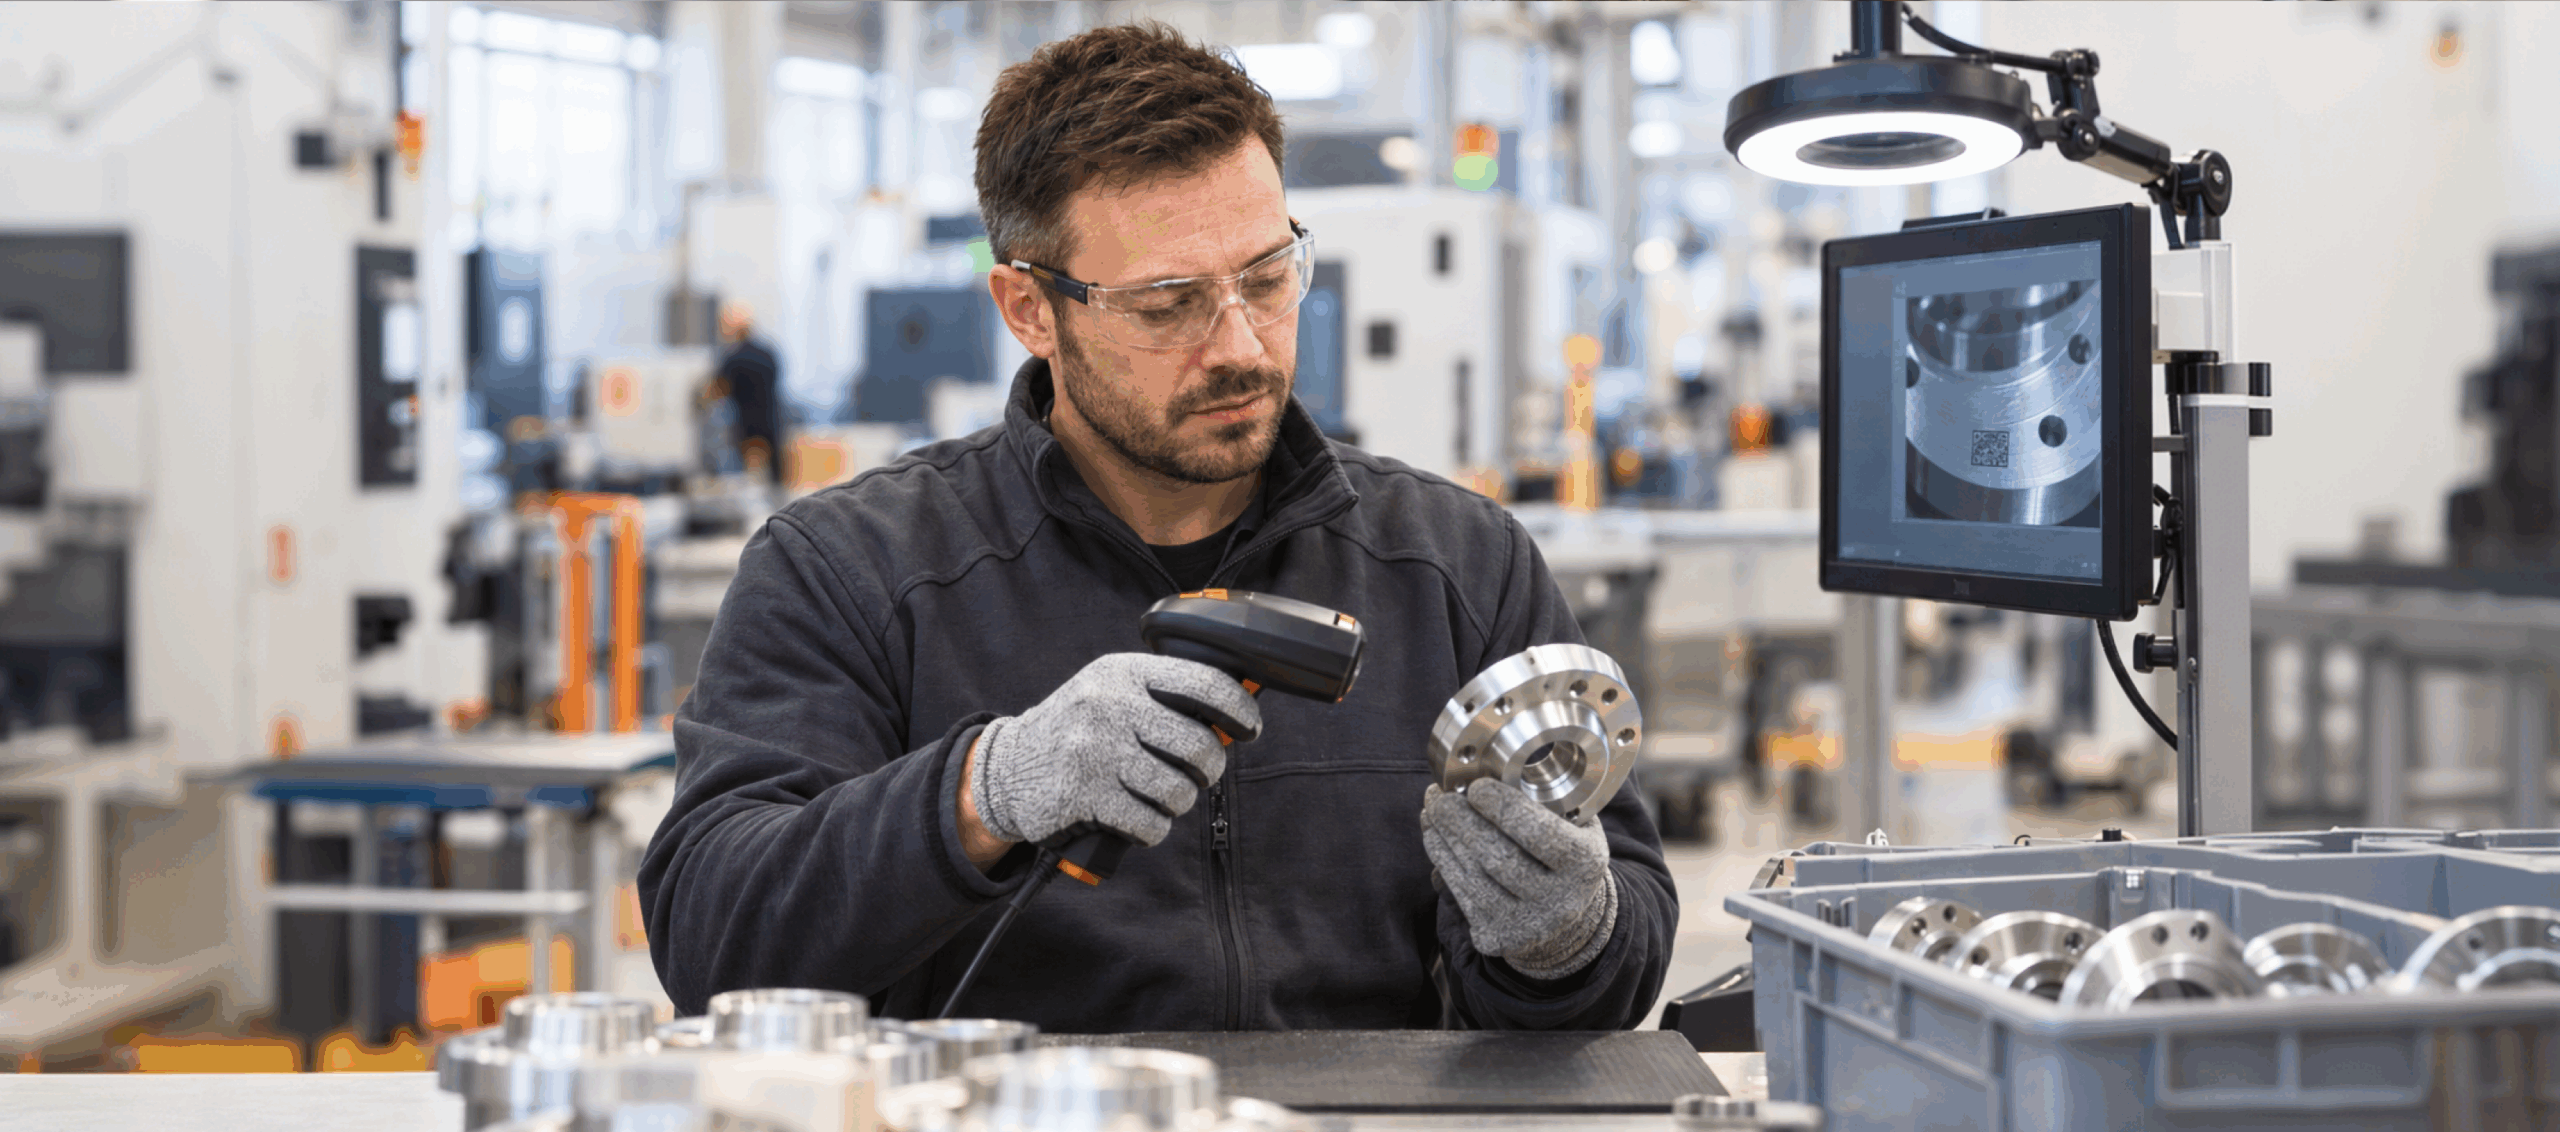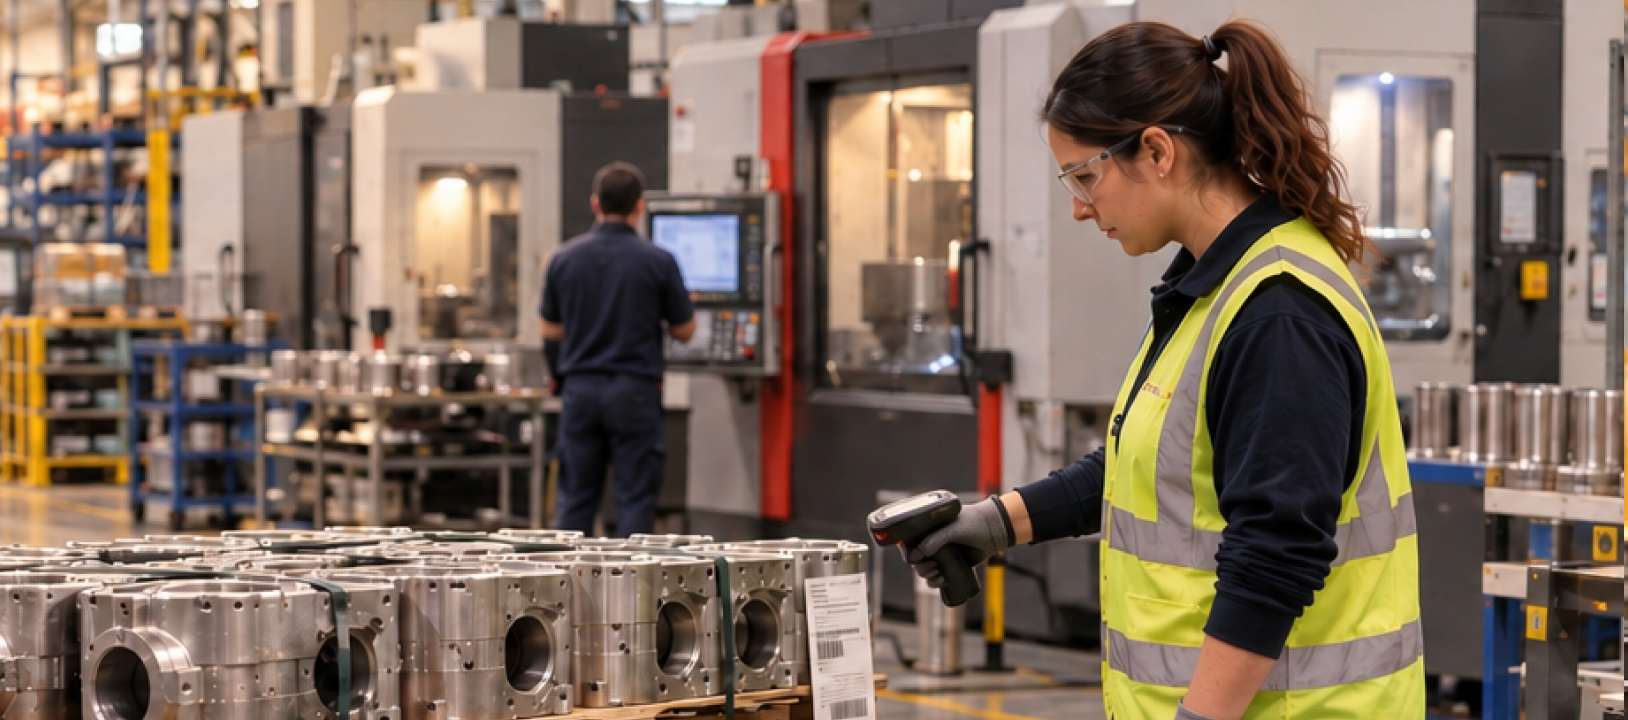




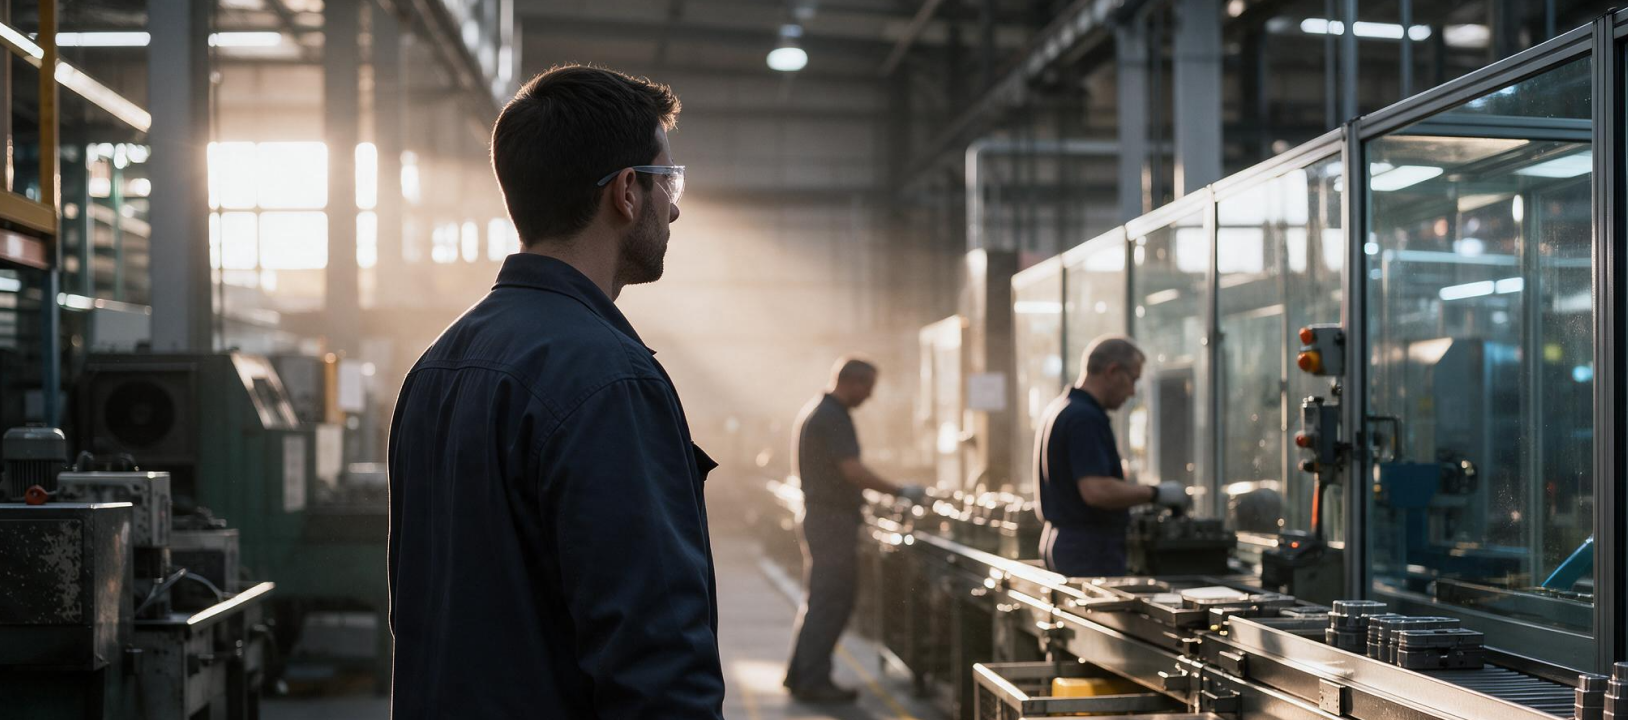


Consider an illustrative shift. The line reports a respectable OEE result, yet output falls below plan. A feeder hesitated repeatedly, the changeover ran longer than expected, and a downstream queue kept filling and clearing. None of those events lasted long enough or carried enough context to become an obvious item in the shift report.
Production line monitoring breaks down in this situation because the dashboard is calculating from an incomplete event record. OEE can summarize availability, performance, and quality, but it cannot recover a stop that was never captured, a slow cycle recorded without product context, or a changeover overrun recorded as planned downtime. [2] [3]
The fix is not another dashboard. It is a trustworthy line event model that connects machine state, line state, work-order context, synchronized time, confirmed reason codes, and the action that followed.
The dashboard is the last step, not the source of truth
OEE remains useful. It gives operations teams a common way to discuss availability loss, performance loss, and quality loss. [2] The trouble starts when the plant treats the result as direct evidence rather than the output of a measurement process.
Every dashboard inherits the limits of the capture layer beneath it. A PLC may expose run, idle, fault, and count tags. A historian may sample those tags at intervals. An operator may add a reason code later. MES may know the product and work order, while ERP holds the schedule. If those records use different clocks, definitions, or asset names, the final metric looks precise while its explanation remains weak.
ISA’s guidance on OEE points to this operating problem: plants need standard definitions, consistent collection, and sustained adoption if the metric is going to support improvement work. [3] NIST makes the same issue concrete at the system level. Manufacturing decisions depend on sensing, data infrastructure, and analysis that can show when and why process thresholds were exceeded. [1]
A production line monitoring program should therefore start with a simple question: which events can the current data layer actually observe?
How loss disappears before it reaches OEE
Microstops are the first blind spot. There is no universal duration that separates a microstop from recorded downtime. The threshold depends on the plant, the software, and the process. If the event is shorter than the configured threshold or the sampling interval, it may be absorbed into performance loss without a usable reason. Repetition turns a small classification gap into a recurring throughput problem.
Changeovers create a different problem. Plants often remove planned changeover time from scheduled production. That can be reasonable. The hidden loss is the overrun between the plan and the actual return to stable production. A single start and end timestamp cannot explain whether time went to teardown, cleaning, setup, first-good-part approval, or ramp-to-rate. Phase-level timestamps make the variance visible without pretending every changeover should be identical.
Cycle-time drift is easy to average away. A line can keep running while each cycle becomes slightly less stable. Shift-level averages smooth that variation and may hide the station that is constraining flow. The useful record contains the actual cycle time along with its product, recipe, tool, station, and operating state.
Queue density shows the difference between machine state and line state. One machine may be running correctly while the line is losing output because material is blocked downstream or starved upstream. A machine dashboard sees no fault. A line model sees the changing relationship between buffers, stations, and the current constraint.
Reason codes can hide loss as well. If operators classify events after the shift, repeated short stops often accumulate under broad labels such as “other.” The answer is not to blame the operator. The system should capture the timestamp and candidate cause automatically, then ask for confirmation while the event is still recognizable.
Build a line event model before adding analytics
A useful event record needs more than a timestamp and a fault code. At minimum, it should answer six questions:
- What asset or line segment changed state?
- What state did it enter, and what state did it leave?
- When did the event start and end on a synchronized clock?
- Which product, work order, recipe, tool, and shift were active?
- Which source reported the event, and how confident is the classification?
- Was the reason confirmed, corrected, or left unresolved?
The model should preserve the raw source as well as the normalized event. That matters when two systems disagree. A PLC count may be authoritative for a completed machine cycle, while vision may be better at detecting a jam between controller boundaries. MES may own the work-order identity, but an operator may correct the causal reason. Precedence should depend on the event type, not on a blanket rule that one system is always right.
Standards help reduce translation work. MTConnect provides a semantic vocabulary and structured models for contextualized manufacturing equipment data. [4] OPC UA for Machine Tools defines consistent machine information that applications such as MES, ERP, historians, and monitoring systems can consume. [5] Neither standard solves the plant’s loss taxonomy on its own, but both make it easier to stop rebuilding the same asset and state mappings for every application.

Use the least invasive signal that can prove the event
Brownfield plants rarely need the same sensing method everywhere. The practical choice is the least expensive signal that can observe the event reliably enough.
Existing PLC or OPC UA tags should come first when they already expose the required state, count, alarm, or cycle boundary. A discrete sensor may be a better retrofit for part presence, gate position, or buffer occupancy. Electrical current, vibration, pressure, and temperature signals belong where the question concerns equipment condition, but they should not turn a line-flow initiative into a predictive-maintenance project.
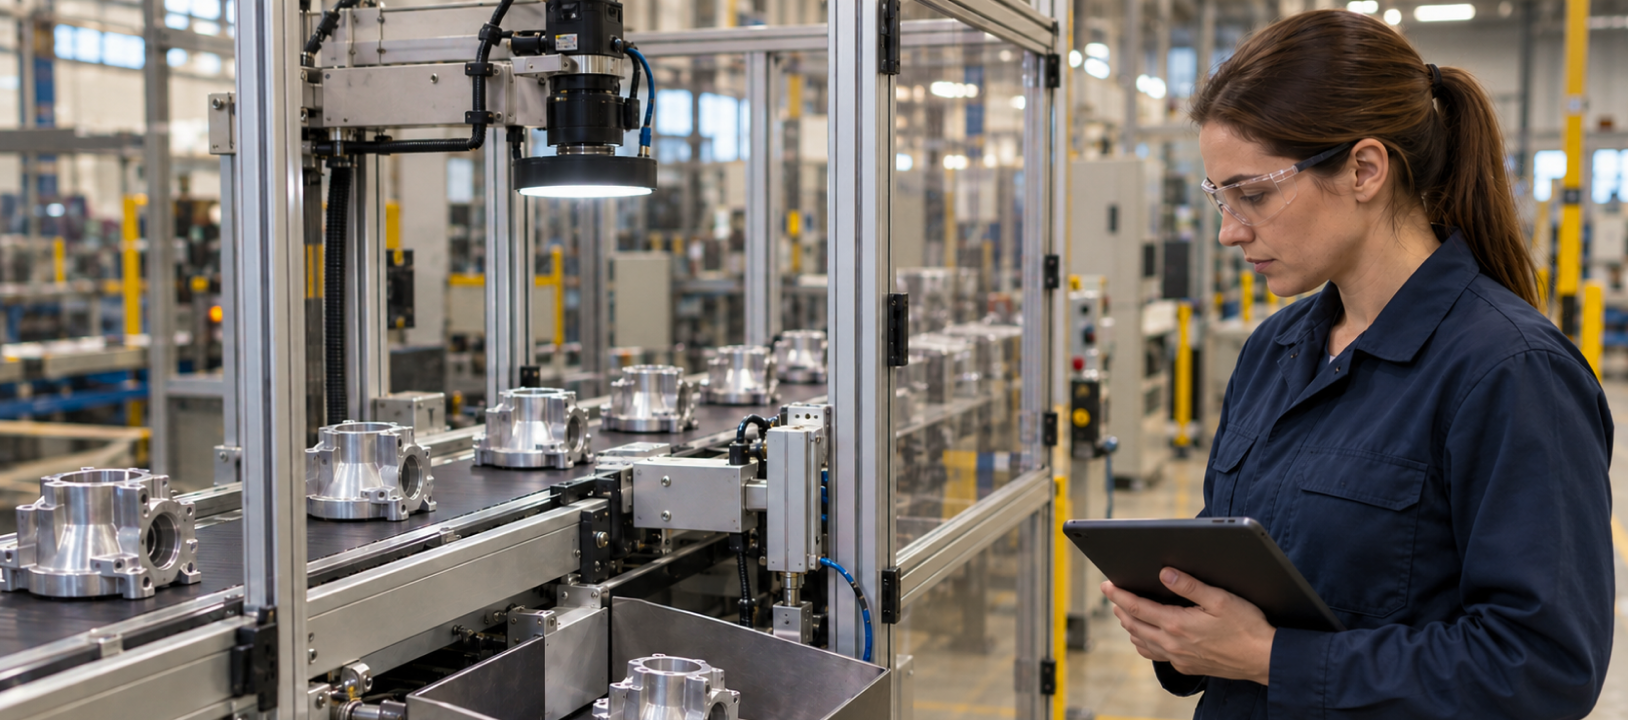
Computer vision earns a place when the event exists outside a controller boundary: a manual station, an intermittent jam, a misfeed, an operator intervention, or a changeover phase that no tag records. Softarex’s manufacturing work includes part tracking, stoppage analysis, cycle time, changeovers, queue density, and integration with MES, ERP, and OT systems. [6] The related visual-inspection playbook also shows why cameras need controlled lighting, positioning, validation data, and an operator feedback process before they belong in production. [8]
Vision should not replace a reliable tag or a simple sensor. It should fill a defined observation gap. A one-shift ground-truth review can then compare detected stops with what actually happened. Teams should measure detection recall, false events, reason-code accuracy, and the amount of loss time left unclassified.
Reference architecture for event-level line monitoring
The architecture can stay small at first. Data capture runs near the line so that short events survive network interruptions and do not depend on a cloud round trip. The edge layer timestamps data from each source, preserves its provenance, and converts raw signals into a shared event schema.
An event and time-series store retains both the normalized record and the measurements needed for investigation. A context service joins each event to MES and ERP data such as product, order, target rate, shift, and planned changeover window. Dashboards and alerts read from that shared model instead of inventing their own definitions.
This is also the missing foundation for a useful digital twin. A twin that reads stale exports can visualize the plant but cannot explain its current operating state. Softarex’s digital-twin guidance treats the live data backbone, asset identity, timestamps, and integration boundaries as prerequisites rather than polish added after the model is built. [7]
OT constraints belong in the design. Use read-only access where possible, segment plant networks, define offline behavior, and set separate retention policies for derived events and raw video. Cameras should be scoped to equipment and process areas. Operators need to know what is collected, why it is collected, and how corrections enter the record.
Prove the model on the constraint line
Start with the line that currently limits output, not the line with the newest equipment. Establish a baseline from one shift of current records, then compare it with direct observation. List every material event the existing system missed, misclassified, or could not connect to a product and work order.
The pilot should pass four gates before it expands:
- Event detection matches the agreed ground truth closely enough for the operational use case.
- Reason codes separate recurring causes instead of growing the “other” bucket.
- Recovered minutes improve throughput at the constraint, rather than only improving a local machine metric.
- Operators use the record during shift reviews and corrective actions.
The result is a decision tool, not a larger reporting layer. Production line monitoring becomes useful when a missed target can be traced to a specific event pattern, source, product context, and owner while the evidence is still current.
Softarex can help assess one line’s observability, map brownfield signals, define the event model, and connect it to existing MES, ERP, historian, and OT systems. The first deliverable should be the gap map: what the line can see now, what it cannot see, and which missing events are worth capturing.
Sources
[1] Monitoring, Diagnostics and Prognostics for Manufacturing Operations | NIST
[2] How to Tap Hidden Manufacturing Potential Using OEE | ISA
[3] Measuring the Value of OEE | ISA
[5] OPC UA for Machine Tools: Machine Monitoring and Job Management | OPC Foundation
[6] Computer Vision & AI Systems for Manufacturing Operations | Softarex
[7] Digital Twin Manufacturing in 2026 | Softarex
[8] Automated Visual Inspection: A Manufacturing Playbook | Softarex